Five short links

Stationfive
Photo by Curtis Perry

The Declassification Engine – "Saving history from official secrecy". A fascinating concept that shows how the firehose of cheap distributed computing power fundamentally changes what privacy and secrecy mean. We can probably reconstruct a lot of information that people think they've hidden in these documents, but what are the rules?

A 63-bit floating point type for 64-bit OCaml – I've never used the language, but I adore the bit-fiddling that goes into floating-point representations, and this is a lovely hack on top of them.

Local geocoder – A lovely minimal reverse geocoder that's self-contained, including data. I've been excited to see a blossoming of open geocoding solutions, Nominatim has improved in leaps and bounds, PostGIS now has some strong capabilities, and I've been having fun with the Data Science Toolkit of course!

How to say nothing in 500 words – Ancient advice about writing that's still useful. "Call a fool a fool"!

Olympians Festival – I've been getting a lot out of the local TheaterPub nights in San Francisco, so I'm excited to make it to this twelve-night festival with a whopping 36 new plays in November! I'm also a sucker for the greek myths, ever since I hear up with Tony 'Blackadder' Robinson's retelling of the Iliad as a kid.

Five short links

Fivetype
Photo by Grant Hutchinson

Assuming everybody else sucked – If an industry is behaving in an apparently irrational way, try to figure out the internal logic that's driving that behavior. You'll be much more effective at breaking the rules if you understand what they are first.

Storing and publishing sensor data – Now we're scattering sensors around like confetti, we're generating ever-growing mounds of time-series data, so here's a good overview of where you can shove it.

100,000 Stars – This WebGL exploration of the universe is so good I feel like this should have already been plastered all over the internet already, but maybe I've been living under a rock?

Mapping the product manifold – I started off in image processing, carried what I'd learned to unstructured text, and now I'm fascinated to see techniques flowing back the other way. We're going to be doing crazily effective recognition of images, language, and every other kind of noisy signal within a few years.

What happened to the crypto dream? – A clear-eyed examination of where the crypto dream of the 90's ended up – ""the demand for technologies that will upset that power balance is quite low".

We’re all starting to track ourselves

Mapscreenshot

We’re releasing a massive and growing amount of information about who we are, where we go, and when. There are hundreds of millions of public checkins already out there, and millions more are being created every day. People think of Foursquare as the leading source, but actually Instagram, Facebook, Twitter, Flickr, Google Plus all produce incredible numbers of geo-located checkins, some of many, many more than Foursquare.

This is going to cause big changes in our world. We’ve already taught our computers what we buy and read, now we’re telling them where we spend our real-world lives. Just our presence at a location at a particular time becomes powerful data when it’s combined with all the other people doing the same thing. We’re instrumenting our movements at a very detailed level, and sending them out into the ether. Even more amazingly, we’re adding high-resolution photos and detailed comments to the checkins.

It’s hard to overstate how effective this data can be at solving intractable problems. Economists, sociologists, and epidemiologists would kill to have detailed pictures of the lives we lead at this kind of scale. There will be applications we haven’t even thought of too, connecting us with people we should be talking to, introducing us to new experiences, all sorts of feedback that will change how we live.

It’s a scary new world to contemplate too of course, which is why I keep blogging about what I’m up to. Recently I’ve been working with my team at Jetpac analyzing billions of photos from all sorts of social sources, to help both tourists and locals figure out where to go and what to do. I want to share an internal tool we use to explore the data, a map interface to the checkins that people have shared publicly. If you want to get a concrete feel for how our world’s changing, check it out:

https://www.jetpac.com/map

It’s still an experimental tool so apologies for any bugs, but I hope you find this glimpse of the mountain of public data we’re all creating as fascinating as I do! You can find all of the individual photos and other checkins out there on the public web, but seeing them accumulated together in one place still blows my mind.

Five short links

Starknot
Photo by Neil Platform1

GeoURI – I have no earthly use for these, but I love that they exist, and are even an IETF standard!

Nathaniel Bowditch – He created the American Practical Navigator over two hundred years ago. He improved the data quality of previous works and made the results widely available in a form non-specialists could easily understand. That approach transformed navigation then, and it's still incredibly effective today across all sorts of fields.

Digital Elevation Data – On that topic Jonathan de Ferranti has spent years painstaking correcting open-source geographic data about the height of the earth's surface, and then releasing the results openly to anyone who needs them. It may be hard for non-geo folks to understand how tough a problem this is, and how hard he's worked on it, so here are some example renders and an independent review.

Sentiment Analysis Corpora – A fantastic summary and comparison of the raw data sets you need to build sentiment analysis algorithms.

A Major Breakthrough in Image Processing – It's time to retire Lena!

Open Sentiment Analysis

Smileyfingers
Photo by Courtney Carmody

Sentiment analysis is fiendishly hard to solve well, but easy to solve to a first approximation. I've been frustrated that there have been no easy free libraries that make the technology available to non-specialists like me. The problem isn't with the code, there are some amazing libraries like NLTK out there, but everyone guards their training sets of word weights jealously. I was pleased to discover that SentiWordNet is now CC-BY-SA, but even better I found that Finn Årup has made a drop-dead simple list of words available under an Open Database License!

With that in hand, I added some basic tokenizing code and was able to implement a new text2sentiment API endpoint for the Data Science Toolkit:

http://www.datasciencetoolkit.org/developerdocs#text2sentiment

Give it a try, it's as simple as a CURL call from the terminal:

curl -d "I hate this hotel" "http://www.datasciencetoolkit.org/text2sentiment"

{"score": -3.0}

I've been having a blast with it, simple-minded as it is, so I hope you do too!

Five short links

Earthlight

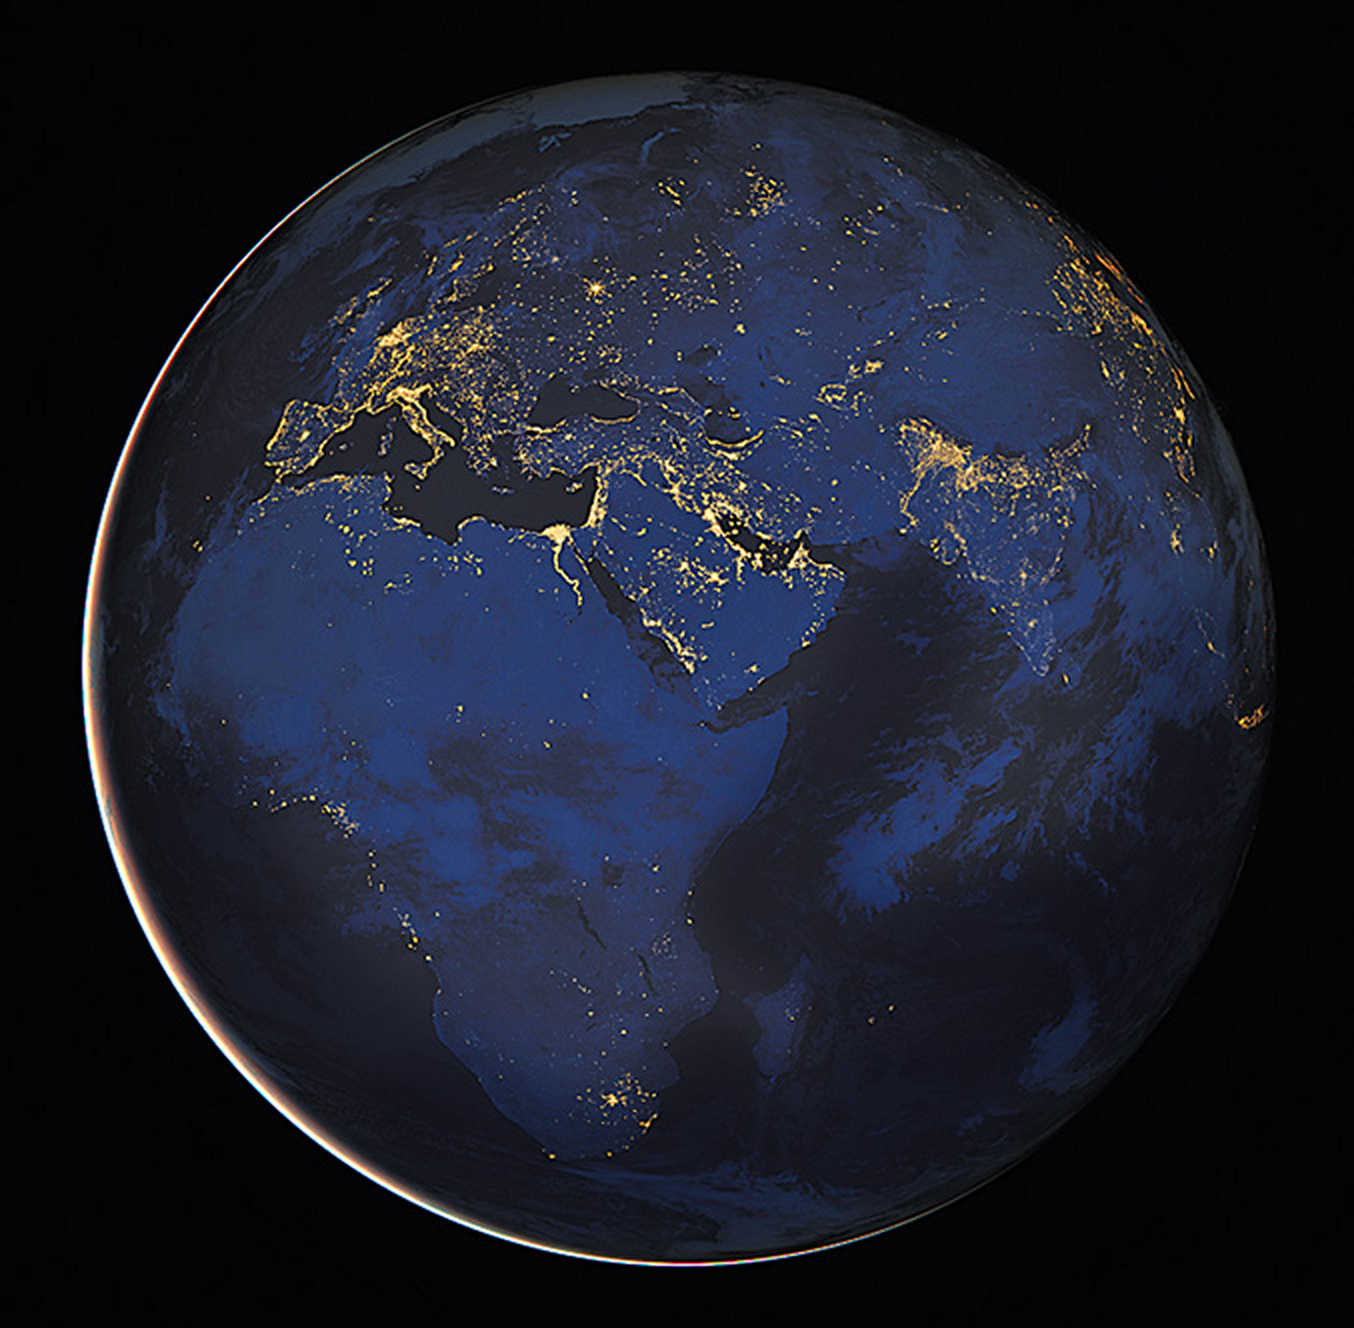
A Global Poverty Map Derived from Satellite Data – This is an old paper from 2006, but I love the idea of using how much light that a neighborhood sends into to the night sky to measure how wealthy it is. Richness is highly correlated with wastefulness, apparently.

Open Multi-lingual WordNets – We’re mapping our inner worlds too, these open data sets are incredibly useful information on word meanings for anyone working with computers and human languages.

The Invisible City – A fake Canadian city briefly appeared on OpenStreetMap, complete with an elaborate public transport network. Or was it briefly a real place blinking in and out of existence, with only a lone volunteer mapper spotting it?

The Dark Side of Social Capital – We usually think of community as a good thing, but anybody who grew up in a small town can tell you that the power can be used to exclude outsiders too.

K2C 1N5 – Ervin Ruci is being hounded by the Canadian Postal Service for the crime of making a crowdsourced database of postal codes freely available, and now they’ve decided they own the copyright to the words “postal code” too!

Five short links

Fiveoclock
Photo by Tasty Goodness

Yoyodyne – How a fictional company was born in the novels of Thomas Pynchon, was adopted by Buckaroo Banzai and Star Trek, and ended up in the GPL.

What will be left of our cities? – The nitty-gritty details of what will happen to our concrete, brick, and steel long after we're dead and gone.

On glitch art, and the fascinating mistakes computers make – I was a terrible VJ with footage, but I had so much fun with live feeds and static. Don't believe technology's mask of perfection, engineers knowwhat a rats' nest every product is under the hood.

Is MS Office the quiet villain of global finance? – Our kids will look back on the last couple of decades as a time when we fell under the spell of cold hard numbers, without really looking at how they were produced.

Search history and accidental class warfare – A variant of the echo chamber effect, and an example of the law of unintended consequences. Recommendation algorithms are becoming our century's version of press barons.

Do we need a slow software movement?

Woolysnail
Photo by Tim Regan

When I was an isolated kid in the English countryside my only connections to the computing world were "Public Domain" floppy disks. Mail-order libraries would send me one of the disks in their catalog if I posted them a pound coin taped to a piece of card. I've never forgotten how important those glimpses into a wider world were, and I'll always be grateful to the people who made their demos, games, and utilities freely available. They were a lifeline to me, and I always wanted to give something back in return. My first contribution was a 'desktop palette' of 16 colors I'd selected for an especially pleasing RISC OS background, which didn't exactly set the world on fire.

That set the tone for most of my open source career – when I release a new project, I expect a deafening silence. There are occasional exceptions, but most of them don't make sense to anyone else, at least at first. The majority get quietly ignored by me and everyone else, but a few I keep working on, and they occasionally get picked up by other people too.

The Data Science Toolkit has turned into one of those sleeper projects. Over the last few months I've had a lot of bug reports, which is the best measure of how many people are actually using the code! There have been some nice companion projects too, like this wrapper for Excel or the new API library for Node. It also powers OpenHeatMap.com, which also keeps growing like a weed entirely through word of mouth. Hearing about the uses has been fascinating; academics of 19th century American literature mapping the spread of place mentions, reporters analyzing documents to track corruption in developing countries, mobile real estate app startups, university alumni associations.

The common thread for everyone using it is that they're marginal, just like I was growing up. There aren't enough of them and they don't have enough money to tempt commercial developers. Young open source software grows in the cracks between profitable problems, and survives on a starvation diet of spare-time coding. This gives it the time to find its niche, its audience, in a way that a more conventional development approach never could. Slow-growing software has the chance to reach people who'd never be found any other way, so if you're working on an unpopular project that you love, don't give up!

Five short links

Fivepound
Photo by Kurtis Garbutt

Geo-location estimation of Flickr images – The caption, title, and description of a photo is incredibly useful when it comes to guessing where a photo was taken, even using fairly crude language analysis algorithms. This is a great paper that parallels a lot of what we've found using unstructured text for image location at Jetpac.

Create a heatmap in Excel – Excel can be crusty and hard to learn, but I'm constantly surprised by how much you can do with it once you dive into its depths.

Death by a thousand paper cuts – I get asked the same questions over and over again by people I've just met once they detect my accent – "Where are you from?", "Do you like soccer?", "Why did you come here?". I appreciate that they're trying to connect with me, but the sheer repetition and predictability can make it hard to answer them with enthusiasm.

I can only imagine how tough it must be to deal with repetitive comments when people are behaving like jerks, rather than being nice. Julie does a good job explaining why, even when any single incident can seem fairly minor, an unending succession of them becomes impossible to deal with. The programming world tolerates people behaving like jerks in small ways towards anyone who isn't like them, over and over and over again.

Big Data and Conflict Prevention – The world ignored warning signs about famines and wars from small data, and they're doing the same thing with big data.

Helsinki Bus Station Theory – The case for sticking it through an apprenticeship so you can do something truly creative afterwards.

Converting to and from Google map tile coordinates in PostGIS

Google Maps' system of power-of-two tiles has become a defacto standard, widely used by all sorts of web mapping software. I've found it handy to use as a caching scheme for our data, but the PostGIS calls to use it were getting pretty messy, so I wrapped them up in a few functions. The code is up at https://github.com/petewarden/postgis2gmap, and here's a quick rundown:

tile_indices_for_lonlat(lonlat geography, zoom_level int)

Takes a PostGIS latitude/longitude point and a zoom level, and returns a geometry object where the X component is the longitude index of the tile, and the Y component is the latitude index. These values are not rounded, so for a lot of purposes you'll need to FLOOR() them both, eg;

SELECT FLOOR(X(tile_indices_for_lonlat(checkins.lonlat, 4))) AS grid_lon, FLOOR(Y(tile_indices_for_lonlat(checkins.lonlat, 4))) AS grid_lat FROM checkins;

lonlat_for_tile_indices(lat_index float8, lon_index float8, zoom_level int)

Does the inverse of the function above, turning a Google Maps tile index for a given zoom level into a PostGIS geometry point. You may notice that the coordinates are given as separate arguments rather than a single geometry object. That's an artifact of how my data is stored. Here's an example:

SELECT X(lonlat_for_tile_indices(6, 2, 4)::geometry), Y(lonlat_for_tile_indices(6, 2, 4)::geometry);

bounds_for_tile_indices(lat_index float8, lon_index float8, zoom_level int)

This takes latitude and longitude coordinates for a tile, and a zoom level, and returns a geography object containing the bounding box for that tile. I mainly use this for limiting queries on geographic data to a particular tile, eg;

SELECT * FROM checkins WHERE ST_Intersects(lonlat, bounds_for_tile_indices(6, 2, 4);