Clapham is a hole, and other curiosities of the London Underground

I never lived in London, but my Gran was born within sound of the Bow Bells and I’ve spent enough time there to know how important the London Underground network is. The distance as the crow flies is far less important than how accessible the start and destination of any journey are by Tube. I’ve always wondered how the city would look if you could see how far everywhere was from a station, so I grabbed a list of the locations (compiled by OpenStreetMap volunteers) and uploaded them to OpenHeatMap. A few surprises leapt out at me:
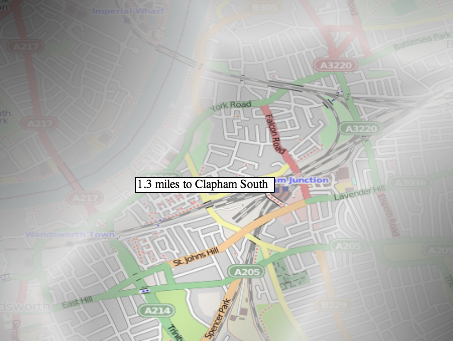
Clapham is a hole

Claphamhole2

Clapham Junction is one of the busiest above-ground stations in the world, but it’s nearly a mile and a half to the nearest Underground line. The whole area is a big, gaping hole in the coverage of the network, and you have to wonder if some nameless Tube planner had it in for the place?

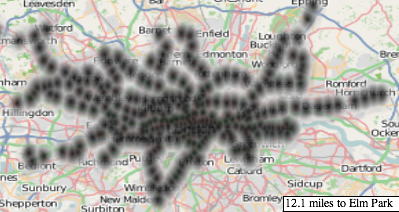
It’s Grim Down South
Southunderground

There’s a lot more lines north of the river than in South London. I have no idea why, but I know I want a direct line to Chessington for when I’m visiting my Grandad (and no, he’s not in the World of Adventure!)

Tubes-end

Chesham

Though the map of the Underground has all the elegance of a fly on a windshield, I was intrigued by a few of the feelers shooting out across the landscape. Chesham is the furthest ‘underground’ station from central London, though it doesn’t appear very subterranean to me. On the far north-west of the map, in the wild, howling wasteland of Buckinghamshire, it has the fewest visitors of any station in the network, but does have the distinction of being the most popular starting point for the Tube Challenge. Thanks to Wikipedia, I’ve learned that this involves trying to beat the Guinness World Record for visiting all 270 Tube stations in the shortest possible time. Apparently this has been going on for decades (1979 to 2000 was the ‘Bob Robinson Era’) but recently advanced computing techniques have been used to find more and more optimal routes.

I really do miss Britain sometimes, no other nation comes close to our skill at finding wonderfully creative ways to waste time. Now I need to get back to my game of Mornington Crescent…

OpenHeatMap launches

Screenshot6

I learned a lot from my Five Nations of Facebook post, but the biggest lesson was how good maps are at telling complicated stories in a simple way. It left me wanting to build more of them, but I didn't want to code up a whole new piece of software for each one. I spent some time looking around for some applications to help me build online interactive maps, but couldn't find any that met my needs. So, I set out to build the tools I wished I had.

Six months later, I'm finally launching the first public release of OpenHeatMap. What is it? For a quick answer check out the gallery, but the long version is that there's two sides, a service for users and an open-source framework for developers. Here's what each offers.

For Users

My one-sentence description is "YouTube for maps". If you have location data in an Excel spreadsheet, you can save it out as a CSV file, upload it to OpenHeatMap and get an interactive online map that you can customize, share and embed.

For Developers

OpenHeatMap is a JQuery plugin for embedding maps in your page. It will render in either Flash or Canvas to work across as many platforms as possible. I've licensed it under the GPL, the code is on github, and all of the data sources are under open-source licenses, so you should be able to use it without any of the pesky terms-of-service restrictions that come with some of the commercial solutions.

I'm still working like crazy to iron out bugs and improve the service (trying to get it working a lot more reliably on the iPhone for example), so please give it a try and let me know what you think via pete@mailana.com. I'll be blogging about some of my favorite maps over the next few days, so let me know if you create some that you'd like to share as well.

And finally a big thanks to everyone who's helped me get the project this far, all of the pre-release testing and feedback from my regular readers was incredibly helpful. In particular I'd like to thank:

Steve Coast for giving me the initial drunken shove towards building this

Peter Batty for educating a newbie on the geo world

Michal Migurski for creating so many awesome maps, and giving early feedback

Dan Armstrong for insightful guidance on what data analytics professionals like him really need

Joe Kelly and Chris Hathaway for generously sharing some fascinating data sets

Josh, Rob and Jud for their constant support and testing help

Five short links

Lakegranby
(I’m just back from a two-night camping trip at Lake Granby high in the Rockies, and that’s a view from our site)

How to nurture data scientists – There’s a whole new generation of data geeks quietly emerging who don’t fit in with the traditional classifications and Ben covers what they need to thrive within an organization. “The web is awash with data, much of which might be useful for your business analysis if you had a team of data scientists”

WhereDoYouGo – A fascinating open-source project to map your FourSquare habits via @rgaidot

Getting started with Map ReduceScott Hendrickson saved my bacon at the last Boulder/Denver Hadoop meetup. I’d left the location and talk arrangements until the last minute but he came through with a killer beginners guide to Amazon’s Elastic MapReduce service. He’s uploaded the slides here, and though his narration was hilarious, even just the notes and the links he includes are valuable for anyone thinking of using Hadoop

AggData – What is it with Texas and data startups? I’m already a big fan of 80Legs and InfoChimps, and just discovered this source of data sets in the Lone Star state. What’s really interesting is that it’s all publicly available information, with a lot of store locations pulled from websites, but it’s hard to gather unless you’re willing to do some serious head-scratching writing your own crawlers.

Rent-a-treehouse – I don’t normally respond to SEO people who want me to promote their sites, but when Chris Horner emailed me I was actually pretty fascinated by these odd European vacation rentals, so I decided to pass them along for free. You could also have your pick of a couple of castles, a shepherd’s hut or even a cave.

Five short links

Fifthelement
Picture by Esther Kirby

Cybercasing the Joint: On the Privacy Implications of Geo‐Tagging – A thought-provoking paper that looks at the real-world security holes that the new streams of location information create. A great example is the coordinates silently embedded in many photos – if you post a picture of a valuable item to Craigslist then anyone could work out where you live, and so where to steal it from

Free GIS Data – A small but useful collection of geographic data sets. This together with the world boundaries at Thematic Mapping opens up a lot of possibilities for geographic visualizations

Heat maps with the Google Flash API – This tutorial walks you through the coding steps you need to create your own thematic maps

Should BP nuke its leaking well? – After spending a childhood so convinced a nuclear apocalypse was imminent that I used to refuse to go into town with my parents, I’ve retained a fascination with the weapons, so I was glad to see an in-depth analysis of this idea. My favorite quote by far is “I would recommend that the international community not listen to the Russians. Especially those of them that offer crazy ideas. Russians are keen on offering things, especially insane things.”

A phone call from the census – I wonder is this is the equivalent of a Rorschach blot for your attitude to name-badge employees? Erik Gordon seems baffled by the fact that the census employee calling him has to rigidly stick to a script as she checks the census details he’d mailed in, and gets self-righteously stroppy. Reading it as someone who was forced to ask “Would you like cashback?” to every single customer at my checkout no matter how inappropriate it seemed or risk getting fired, I just feel bad for the girl who’s calling. Spending a bit of time on the bottom rungs of companies with that level of hyper-controlled process makes you look at these encounters differently.

Five short links

Streetbarchart
Photo by Broken Simulcra

Email Data Source – These guys had a cunning idea – listen in to commercial mailing lists by subscribing to them. They then analyze all of the data they gather to build a detailed picture of different industries and companies email marketing. It surprised me at first, but a lot of the companies I talk find their email lists are their most effective marketing channels despite their distinct lack of trendiness, so I'm pleased to see someone innovating around them.

Brien Lane, Melbourne – This Australian alley has been covered with charts representing real demographic information from the area. I love seeing visualization like this out in the real world, it makes me want to visit. Here's some more photos.

Clue is a renewable resource – This reminds me so much of my experiences at Apple. I spent over a year battling their legal department to honor an agreement we'd made when I joined, to allow me to just fix bugs in the same open-source project that had got me hired. A good friend spent a lot longer trying to get them to sign off on an Objective C mode he'd built for Emacs, and as far as I know still hasn't succeeded in releasing that simple config into the wild with the company's blessing. And Apple is actually one of the good guys when it comes to open-source, so I can only imagine what some other places must be like.

Chartbeat for the ChatRoulette site – I've been using Chartbeat on one of my own sites recently, but actually seeing it running on a site with serious numbers of visitors makes its power a lot clearer.

Official Seattle crime map – While it's nowhere near as slick as others like the San Francisco Crimespotting map, I'm impressed to see a city government produce one of these for themselves. Hopefully more official bodies will see the advantages of making data available in an easy-to-use form like this.

Five short links

Congoportrait

Portraits from the Congo at 50 – An astonishing collection of photos showing people living in the DR of Congo, together with short stories talking about their lives. Anyone who’s read In the Footsteps of Mr Kurtz will understand what a hell-on-earth the Congo has been for the last hundred years, but the tenacity of people determined to keep living their lives is amazing.

Conspiratorial Thinking – The best explanation I’ve seen of why otherwise-smart people can go spectacularly wrong when they only have a superficial understanding of a domain. The other side of any argument rarely consists of idiots and crazy people, so when I find myself asking “how could they be so dumb?”, it’s usually a sign I’m missing something important.

Mountain Lion Kittens in the Santa Monica Mountains – Liz was lucky enough to see the back end of a lion disappearing down a trail when we lived in LA. I never saw one myself, but always felt amazed to be living in a place so wild it still had them roaming free.

Data sets for data mining – A good list of high-quality sources of large data sets

Goin’ down that road feeling bad – At the start of this song Woody Guthrie talks about its creator, how “he wrote this song… or got it started”. The dominant model of the 20th century was the ‘auteur theory’, trying to find a single person to focus on as the sole driving force behind any project, but I felt the way Woody phrased it there captures a lot more of the reality of the creative process. Everything worthwhile I’ve been involved in has taken both a crazy person to start things rolling and a lot of people to join in and actually build it. I feel a post about “folk coding” coming on, it feels like the open source world has a lot in common with the way traditional music was passed around and improved.

Five short links

Fivehands
Photo by Search Engine People

Informed Consent in Information Technology – An awesome PhD thesis on the problems with those ridiculous license agreements we all click through without reading, and even better with some practical suggestions on how to fix those problems. Apparently Catherine's now looking for more funding to continue her work – am I allowed to dream that Apple or Microsoft might want to bring her on board to fix their EULAs?

TravellerMap – I was never quite cool enough to play the Traveller role-playing game back in the 80's, but they built a fascinating background universe. I stumbled across this site by accident, but the author has built a beautifully detailed interactive map for exploring the whole galaxy, and I'm in awe of this as a labor of love.

Analysis of the 'Flash Crash' – I've always been hooked on odd events, and May's sudden stock-market drop and recovery is one of the oddest I've come across. I don't have enough financial world chops to understand everything in this paper, but it's a detailed technical post-mortem of what actually happened.

Wikiposit – Another rich collection of public data sets, mostly financial, with the site code released under the GPL

Swarm Light – This art installation sends shivers down my spine every time I watch it, and it's a technical masterpiece too, using hundreds of CPUs to control the lights. Make sure you go to 1'30'' in the video, that's where it really starts to take off.

Don’t shave that yak – God loves lazy programmers

Yakshaving
Photo by Liminal Mike

I just wasted four days of my life on something completely worthless. It started off innocently enough, I wanted to take a cloud of data points and display them as a nice heatmap.

The Story

Hmmm, sounds just like the mesh creation I used to do when I was back in games, so let's dust off that Computational Geometry textbook and write a Delaunay Triangulator. Sweet, there's even an example in Javascript I can adapt to Actionscript. Awesome, it all works on my test data. Oh, it's O(n^2) in complexity, so it doesn't work so well on my larger test of 1,000 points, and it will take the lifetime of the universe to process the 30,000 points I need it to.

No worries, I'm a clever chap, I'll dig through the literature and find a better algorithm. They all seem to be either too complex to implement easily or don't have the performance characteristics I need. I don't need a strict Delaunay arrangement, so I should be able to brew up my own divide-and-conquer version that uses the exact algorithm on sub-sets of the points and then stitches them back together with Delaunay-like strips.

Huh, looks like there's a bug in the convex hull creation code I wrote. And another. And another. Arrrggh! I need a better way of visualizing what's going on, so I'll build a canvas-based web page that lets me view the output of my algorithm. And then I need to…

What? It's Saturday afternoon? Where did my week go! And why am I still banging my head against this code? What was I trying to do again? Oh yes, display a heatmap of these points. So why have I been debugging convex hull merging code for the last two days? There must be a simpler way.

<… two hours pass …>

There we are, I just adapted some point blob rendering code I was already using, so I don't have to worry about triangulating a massive cloud of points, I just throw blobs at the screen and build up the image. Works great. Now I just have to write a blog post to remind myself once again – *Never Shave a Yak!*

The Lesson

Yak shaving is a term I first ran across in the Jargon File, and it stuck in my head because it's so common and so dangerous in programming. It's when you're working on a task because you need to do it to get something else done, which you're doing to complete another job, and so on up a long dependency chain towards your real goal. This happens a lot when you're coding, and just like my story each step is very logical but you ultimately end up wasting massive amounts of time on something that has very little effect on what you really want to do.

I swear that the biggest reason I'm a more effective programmer now than when I was 20 is that I'm better at spotting when I'm shaving a yak, and finding another way. The biggest clue is when I'm working too hard. I went into a serious deep dive for the last few days, staying up late, skipping dog walks and getting way behind on my emails (sorry to anyone waiting for a reply!). If I'm making progress on something core this sort of crunch time is actually an energizing process as long as I don't keep it up too long. In this case I was feeling frustrated, and looking back it was largely because it was a peripheral task that at some level I knew didn't have to be solved.

There's already lots of other reasons to embrace lazy programming. Fewer lines of code means fewer bugs. The best route to an easy life is writing solid code that doesn't require constant maintenance, and is documented enough so people don't bug you with questions. Harness your inner laziness to spot yak shaving too, and find a simpler way when you're spinning your wheels on a peripheral task.