Jetpac is building a modern version of Yelp, using Big Data rather than user reviews. People take a billion photos every day, and many of these are shared publicly on social networks. We’re analyzing these pictures to build better descriptions of bars, restaurants, hotels, and other venues around the world.
When you see a label like “Hipsters” in the app, you probably wonder where it comes from. The short answer is that we’re spotting places that have a lot of mustaches! There’s a lot going on under the hood to reach that conclusion, and we’ve had fun building some pretty unusual algorithms, so I’ll be geeking out a bit about how we do it.
One thing to bear in mind when digging into this is that we’re in the engineering business, not research, so our goal is to build tools that meet our needs, rather than trying to perform basic science. While I’ve included the results of our internal testing, nothing here has gone through rigorous peer review, so use our conclusions with care. The ultimate proof is in the app, which I’m damn proud of, so please download it and see for yourself!
Image-based measurements
The most important information we pull out is from the image pixels. These tell us a lot about the places and people who are in the photos, especially since we have hundreds or thousands of pictures for most locations.
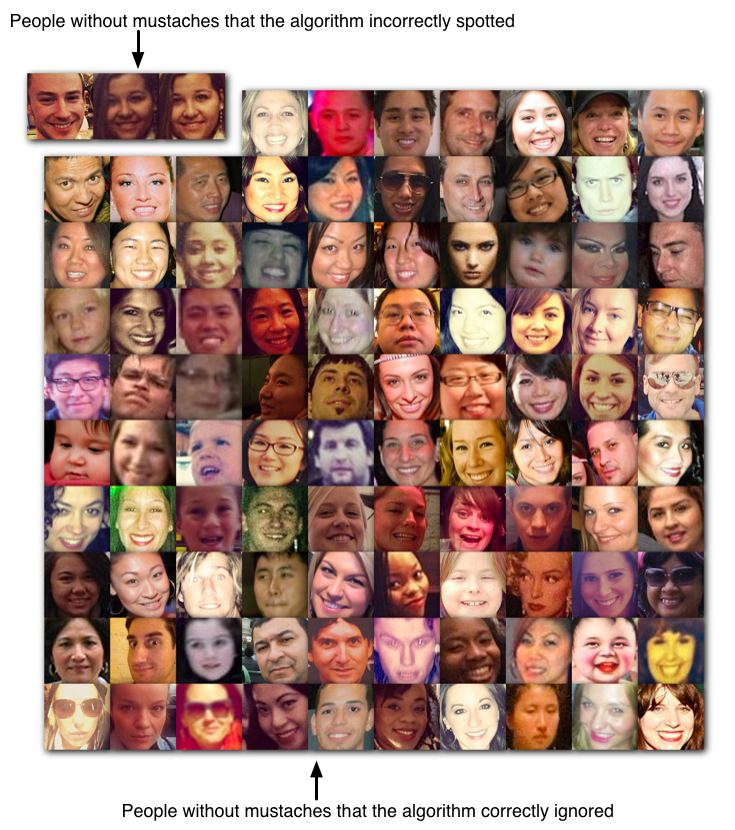
One very important difference between what we’re doing with Big Data and traditional computer vision applications is that we can tolerate a lot more noise in our recognition tests. We’re trying to analyze the properties of one object (a bar for example) based on hundreds of pictures taken there. That means we can afford to have some errors in whether we think an individual photo is a match, as long as the errors are random enough to cancel themselves out over those sort of sample sizes. For example, we only spot 18% of actual mustaches, and we mistakenly think 1.5% of the clean-shaven people we see have facial hair. This would be useless for making a decision on an individual photo, but it’s very effective at categorizing a population of people.
Imagine one bar that has a hundred photos of people, and in reality none of them have mustaches. We’ll likely see one or two mistakenly tagged as having mustaches, giving a mustache rating of 0.01 or 0.02. Now picture another bar where 25 of the hundred people have mustaches. We’ll spot four or five of those mustaches, along with probably one mistaken bare-face, giving a mustache rating of 0.05 or 0.06.
“All models are wrong, but some are useful.” – George E.P. Box
This might sound like a cheat, and it is, but a useful one! Completely-accurate computer vision is an AI-complete problem, but just like in language translation, the combination of heuristics and large numbers of samples offers an effective alternative to the traditional semantic approach.
We have put together some highly-accurate individual tests too, such as food and sky detection, which are good enough to use for creating slideshows, an application where false positives are a lot more jarring as part of the experience, but the key point is that we’re able to draw on a much wider range of algorithms than traditional object recognition approaches. Because we’re focused on using them for data, any algorithm with a decent correlation to the underlying property helps, even if it would be too noisy to use for returning search results.
Testing
Internally, we use a library of several thousand images that we’ve manually labeled with the attributes we care about as a development set to help us build our algorithms, and then a different set of a thousand or so to validate our results. All of the numbers are based on that training set, and I’ve included grids of one hundred random images to demonstrate the results visually.
We’re interested in how well our algorithms correlate with the underlying property they’re trying to measure, so we’ve been using the Matthews Correlation Coefficient (MCC) to evaluate how well they’re performing. I considered using precision and recall, but these ignore all the negative results that are correctly rejected, which is the right approach for evaluating search results you’re presenting to users, but isn’t as useful as a correlation measurement for a binary classifier. The full testing result numbers are up as a Google spreadsheet, but I’ll be quoting the MCC in the text as our main metric.
Mustaches
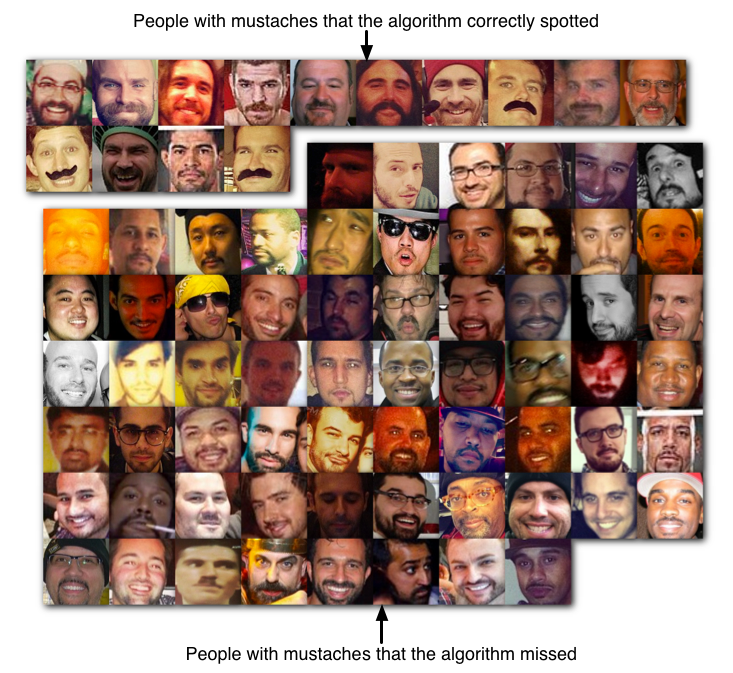
We first find likely faces in a photo using image recognition, and then we analyze the upper lip to determine if there’s a mustache or other facial hair there, with an MCC of 0.29. The false positives tend to be cases where there’s strong overhead lighting, giving a dark shadow underneath people’s noses. We use the prevalence of mustaches to estimate how many hipsters inhabit a venue.

Results on photos with mustaches
.

Results on people without mustaches
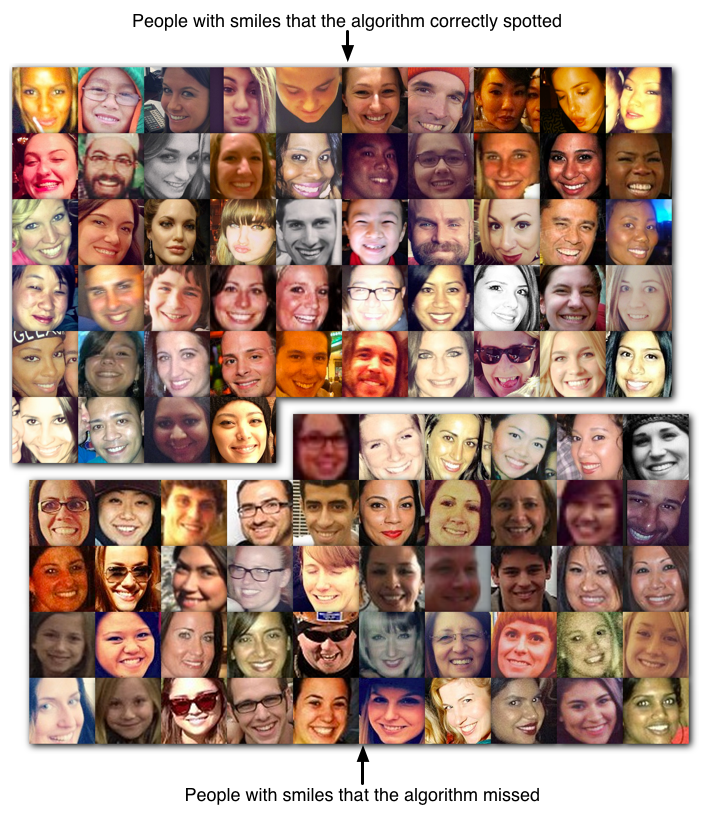
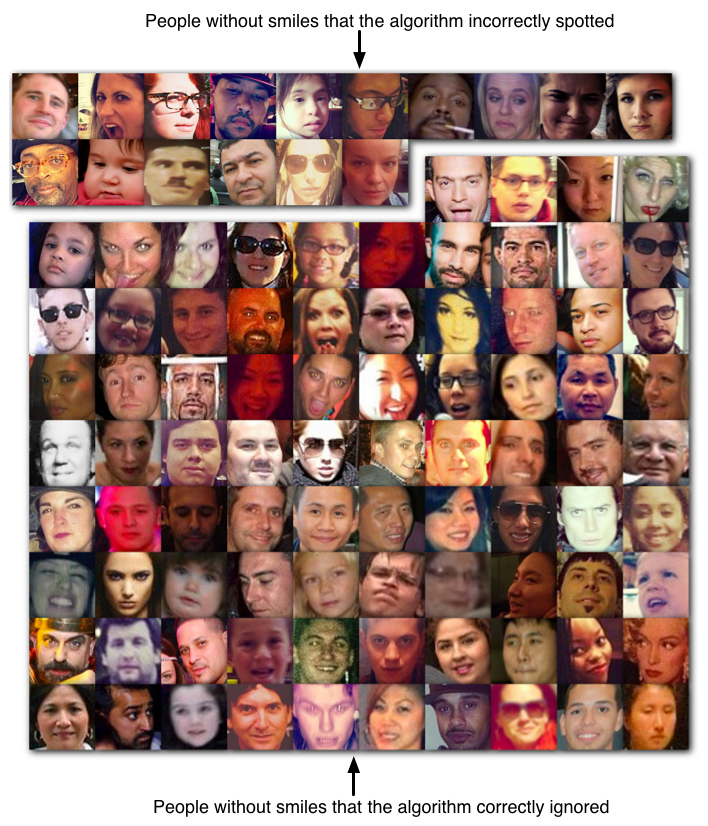
Smiles
Once we’ve found faces, we run pattern recognition to look for mouths that appear to be smiling. We’re looking for toothy smiles, rather than more subtle grins. The metric gives us an MCC of 0.41. The measurement we get out is actually the number of pixels in the image we detect being a part of a smile, so large smiles have more weight than smaller ones. We use the number of smiles to estimate how good of a time people are having at a place.

Results on people with smiles
.

Results on people without smiles
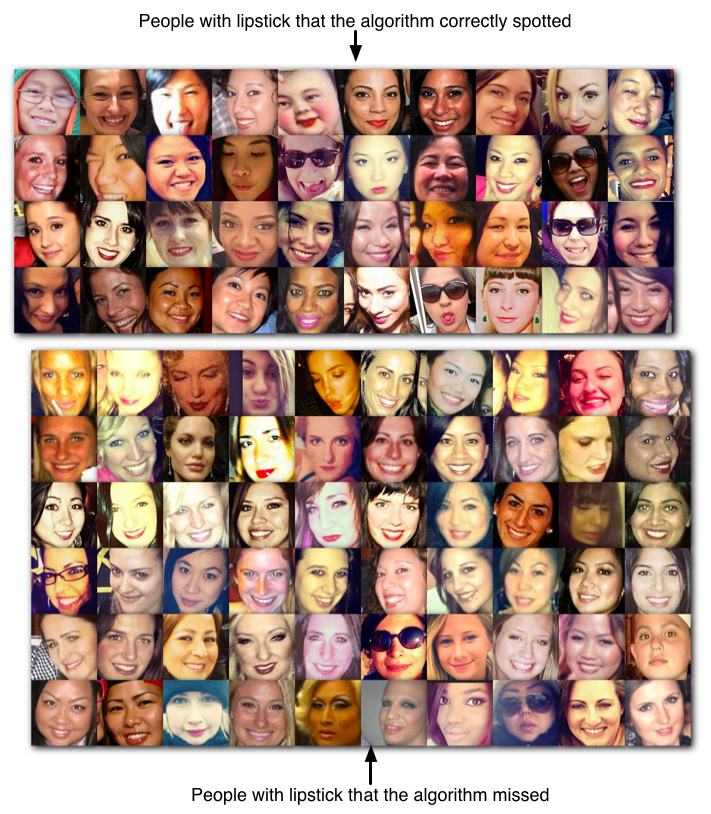
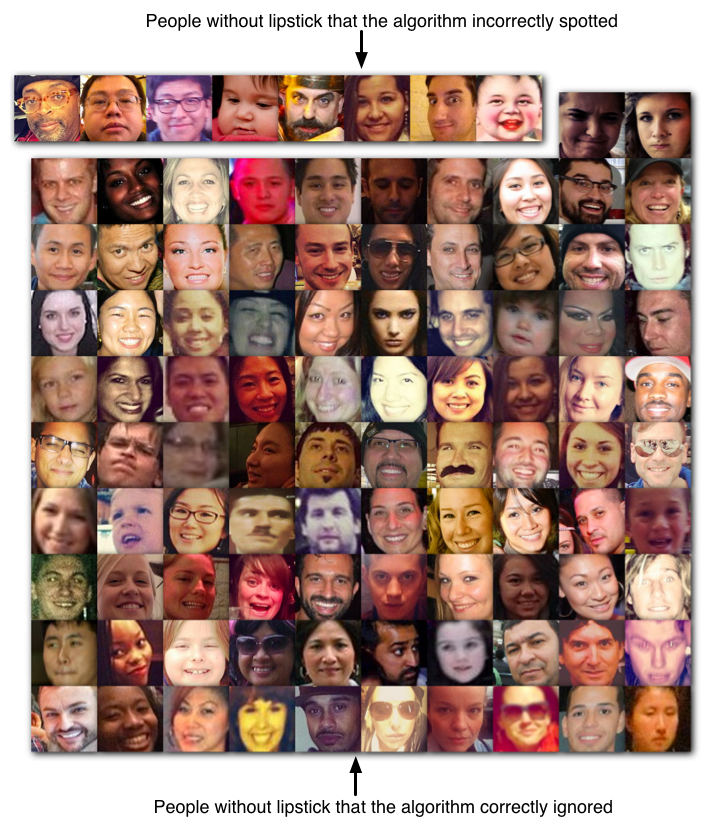
Lipstick
We look for an area of bright-red color in the lower half of any faces we detect. We have an MCC of 0.36, with some of the false positives caused by people with naturally red lips. The amount of lipstick found is used to calculate how dressy and glamorous a bar or club is.

Results on people with lipstick
.

Results on people without lipstick
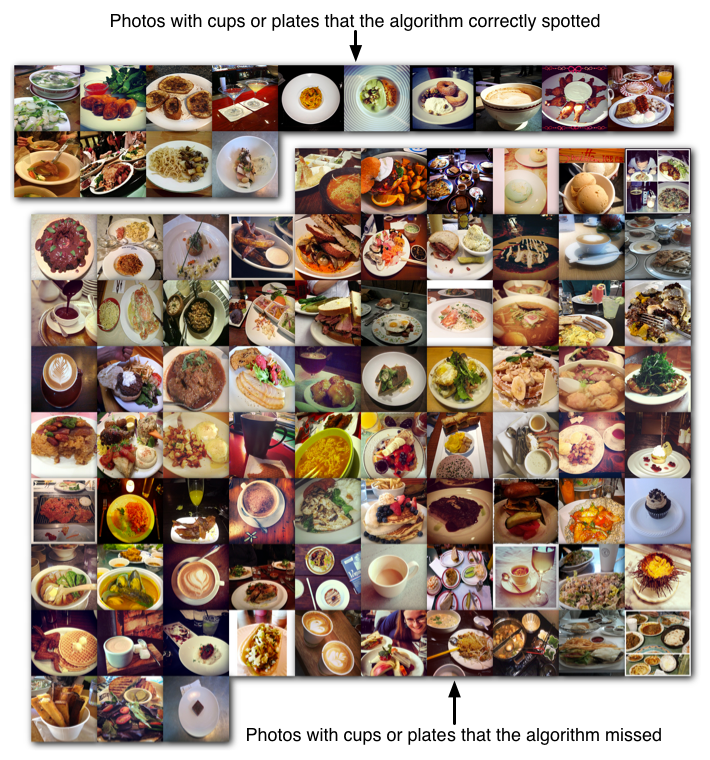
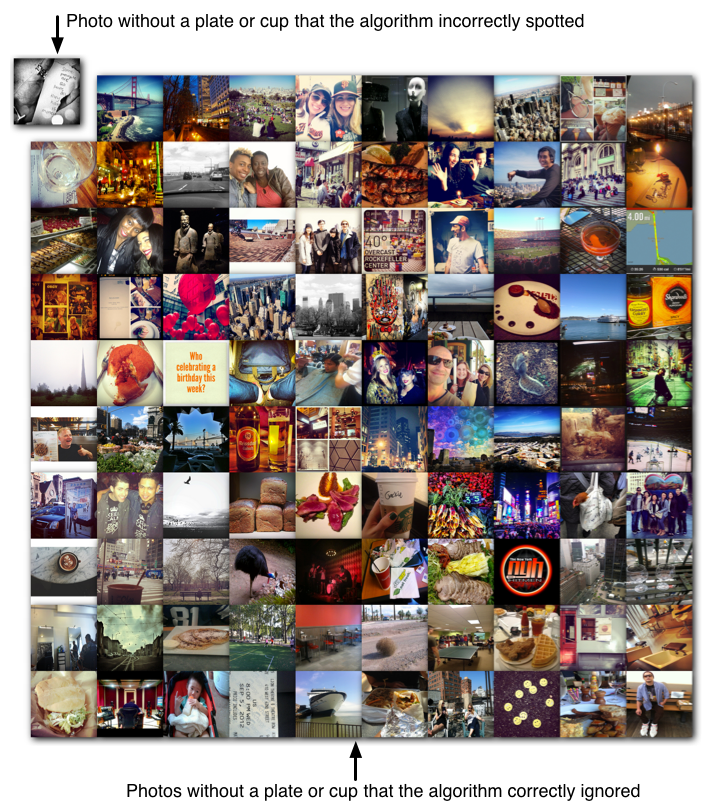
Plates
We run an algorithm that looks for plates or cups taking up most of the photo. It’s fairly picky, with a precision of 0.78, but a recall of just 0.15, and an MCC of 0.32. If a lot of people are taking photos of their meals or coffee, we assume that there’s something remarkable about what’s being served, and that it’s popular with foodies.

Results on photos with large plates or cups
.

Results on photos without large plates or cups
Exposed chest
We look about half a head’s height below a detected face, and see how large a contiguous area of skin-colored pixels is exposed. This will detect bare chests, and low-cut dresses, with the value we get out corresponding to how much skin is exposed. We use this measurement to estimate how risqué a bar or nightclub is. Pink sweaters and other items at chest height can easily cause false positives, so it requires quite a large sample size to have much confidence in the results.
Skin
The skin detection algorithm is simple, looking at which pixels are within a particular ‘flesh-colored’ hue range. This simplicity does make it prone to identifying things like beige walls and parchment menus as skin too unfortunately.
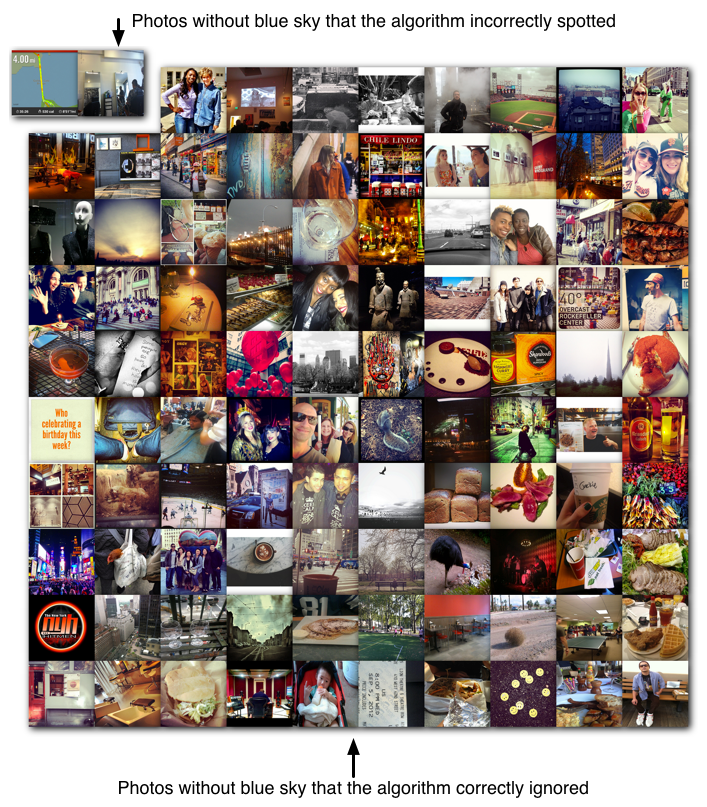
Sky
We scan through the top of the photo, looking for areas that have the color and texture of blue sky. This misses photos taken on overcast days, sunsets, and can be confused by blue ceilings, but has proven effective at judging how scenic a place is, and whether a bar has an outdoor area. Our tests show we get an MCC of 0.84.

Results on photos with blue sky
.

Results on photos without blue skies
Colorfulness
This measures what proportion of the hue circle is present in the image. It looks at how many different colors are present, rather than how saturated any single color is, trying to find images with a rich range of colors rather than just being garish. Since this is a continuous quality, we don’t have true and false positive statistics, but here’s the results of applying it to one hundred random images, with the most colorful images at the top left, and moving left to right down the image in descending order:

Photos arranged by colorfulness, starting top-left and moving right and down in descending order
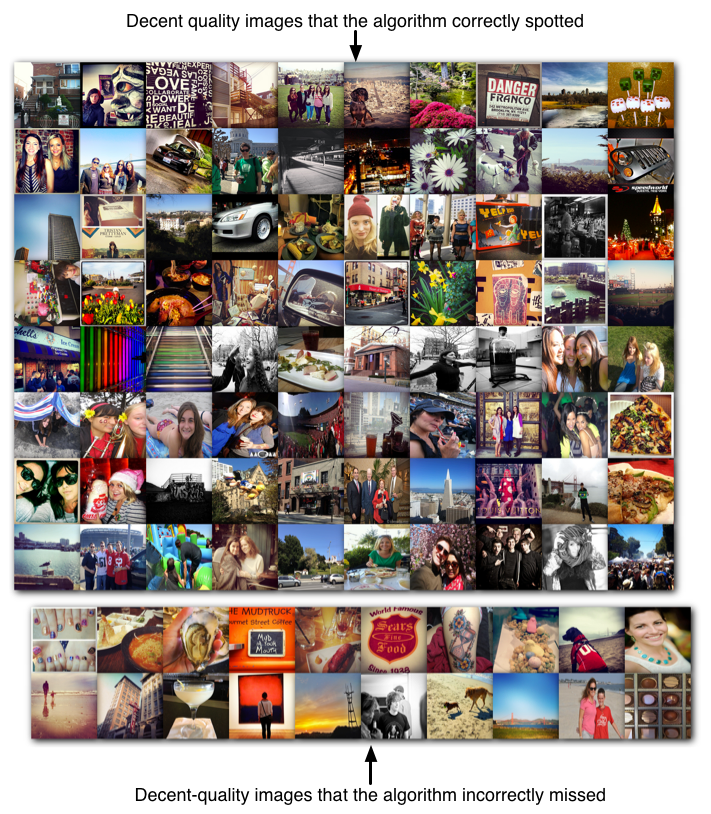
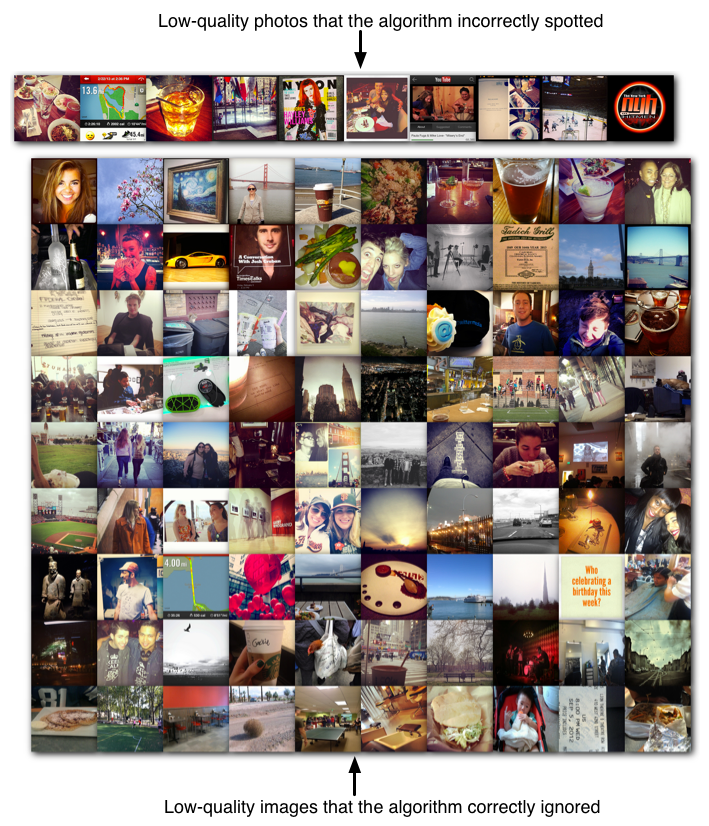
Quality
Bad photos aren’t much fun to look through, so we try to spot common mistakes like bad lighting, composition, focusing, or exposure. This is aimed at getting rid of the worst photos, rather than surfacing the very best, since it’s a lot harder to algorithmically tell the difference between a good photo and a great photo, than it is to distinguish decent pictures from terrible ones. We get an MCC of 0.76.

Results on decent-quality photos
.

Results on lower-quality images
Name-based labels
Some of the information about a venue is gleaned from looking at the names of people who take photos there. https://petewarden.com/2013/06/10/how-does-name-analysis-work/ has a full run-down and source code on how this works.
Asian
We look at how many of the photographers at this venue have typically-Asian family names to figure out which places are particularly popular with Asian people. It’s based on statistics from the US Census, so it’s much less accurate outside America.
Hispanic
Very like the Asian label, this is applied when a lot of the photographers at a venue have a surname that’s prevalent in the Hispanic world.
Men/Women
This measurement uses the first name of the photographer to guess at whether they’re male or female. There are some ambiguous names like Francis, but overall it’s an effective technique.
Behavior-based labels
Some of our venue descriptions come from the other places that their visitors have also been to. These behavior-based labels are applied when the number of people who have been to particular types of places is several times higher than average.
Locals
People who have photographs taken at least 30 days apart in the same city as this venue.
Tourists
Applied to photographers who have a longer history of taking photos elsewhere, but were taking photos in the same city as this place for less than 30 days.
Business Travelers
If someone we’ve identified as a tourist in this city has taken photos at a conference or office, we’ll guess they’re business travelers.
LGBT
This is applied to places where lots of photographers have also taken photos at a gay bar on at least two different occasions.
Ski Bums
Applied to places popular with people who’ve also been to ski resorts.
Gym Bunnies
People who’ve also taken pictures at gyms.
Kung Fu Fighters
Photographers who’ve been to martial arts studios.
Skaters
People who’ve taken photos at skate parks.
Sun Worshippers
Photographers who’ve documented beaches.
Dog People
Places where people who’ve been to dog runs go.
Pet Lovers
If the visitors to this venue have also taken pictures at pet stores or animal shelters, we’ll flag it as popular with pet lovers.
Surfers
People who have shared photos from beaches popular with surfers.
Winos
Oenophiles who have been to vineyards or wine stores.
Sports Fans
Anyone who has taken a photo at a sports stadium on multiple occasions.
Musos
People who’ve been to live music performance spaces like concert halls or music festivals.
Strip Club Denizens
Places where an unusual number of visitors have also shared photos from a strip club.
Students
Anyone who has taken a picture on a college campus.
Parents
Places popular with people who’ve shared photos from schools, day-care centers, toy stores, or theme parks on multiple occasions.
Stoners
Venues where a lot of the photographers have also been to smoke shops.
Jet Setters
People who’ve taken photos from airport buildings on three or more different occasions.
Intellectuals
Venues where the attendees have also been to art galleries, museums, or small theatres.
Startup Folks
Anyone who’s taken a photograph at a tech startup office, or a co-working space.
Outdoorsmen
People who’ve taken hiking, camping, or hunting pictures.
Finding out more
If you’ve made it this far, you’re pretty dedicated, and I salute you! I find this whole area fascinating, and I love chatting with anyone else who’s as interested in it too. I’m @petewarden on Twitter, and my email is pete@jetpac.com, I’d love to hear from you, whether it’s brickbats, bouquets, or just comments!